Visual VM is a versatile tool that helps troubleshooting Java, by visualizing what’s going on inside JVM such as
- Resource Usages (CPU, Memory)
- Thread-related Issues (from missing, or misimplemented synchronization)
- Memory Leak (from leaving unnecessary reference to objects that are not used anymore)
- Code Execution Path (Which code is being executed?) with Sampling.
- The resource usages of a specific portion of Java code (Like spent time)
It’s considered as one of most popular Java profiler, and it’s free :)
IF you’re trying to do some profiling on Java application on your local system, you can just check local Java process. However, if you want to check remote Java process, JMX Port should be activated
- e.g.
-Dcom.sun.management.jmxremote.port=9999
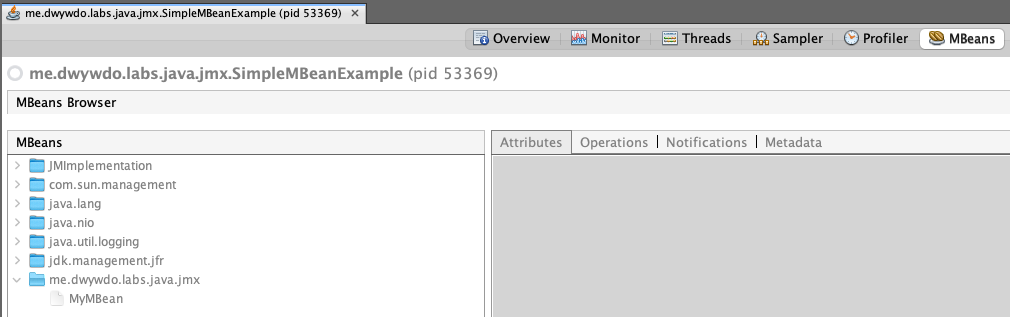
There are many plugins to augment the functionality of Visual VM, and one of them is VisualVM-MBeans. It helps you to check registered MBeans at MBean Server. If you install the plugin, you can see a new tab MBeans
Background
Had not much experience with troubleshooting tools, especially for Java profilers because we had a dedicated team for investigations. These days I’m reading a book (Troubleshooting Java) and learning how to use Java profiler to understand what’s actually happening on your system.
References